Last updated: August 2026
A purity percentage is a summary. The HPLC chromatogram is the data.
When researchers review only the stated purity figure on a Certificate of Analysis, they see a single number derived from a much richer dataset. The chromatogram itself shows peak shape, baseline behavior, the number and distribution of secondary peaks, and how well the separation actually performed.
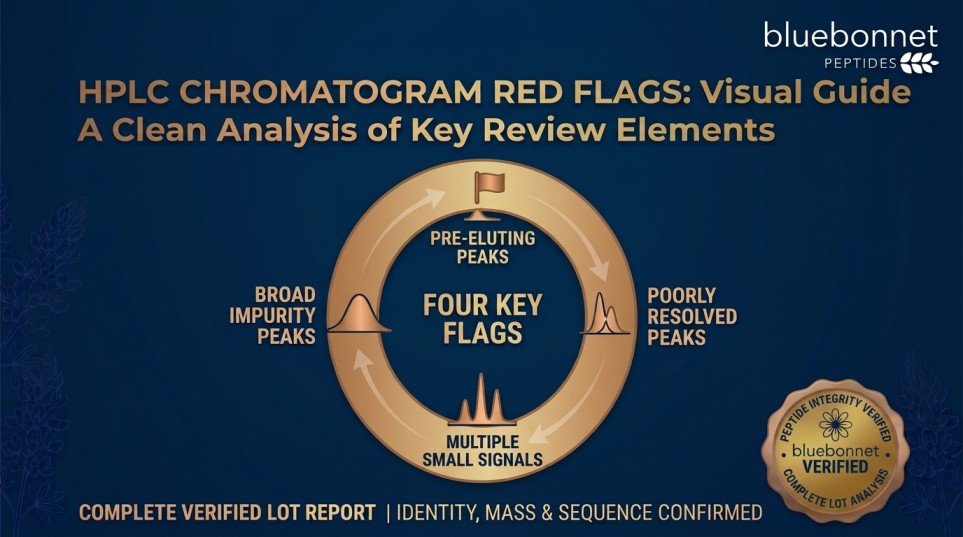
This guide outlines chromatographic features that warrant closer review — and explains why these observations should be treated as prompts for further evaluation rather than conclusions on their own.
An important qualification before proceeding: chromatographic appearance depends heavily on the analytical method and conditions used. Column chemistry, gradient profile, sample load, detection wavelength, and instrument performance all influence how a chromatogram looks. The features described below indicate that additional review or clarification may be appropriate. They do not, by themselves, establish contamination or poor material quality.
Multiple Large Peaks
What to Look For
More than one peak of substantial size, where no single peak clearly dominates the chromatogram.
Why It Warrants Review
In a high-purity peptide sample, one peak should account for the large majority of total integrated area. When two or more peaks are comparably sized, the sample may contain significant amounts of more than one detectable component.
Considerations Before Drawing Conclusions
Some peaks may originate from the sample matrix, solvent, or injection rather than the peptide itself. Certain peptides can also produce multiple peaks under specific conditions due to conformational effects. Comparing against the method description and, where available, mass spectrometry data for individual peaks clarifies the picture.
Significant Impurity Peaks
What to Look For
Secondary peaks that, while smaller than the main peak, represent a meaningful proportion of total peak area.
Why It Warrants Review
Impurity peaks may correspond to synthesis-related species such as deletion sequences, incomplete products, or degradation products. Their size and number contribute directly to the reported purity calculation.
What to Evaluate
- The number of discrete secondary peaks
- The area percentage attributed to each
- Whether they cluster close to the main peak or appear across the run
- Whether the reported purity percentage is consistent with what the chromatogram displays
Impurities near the main peak in retention time may be structurally similar species, which are typically the most challenging to separate during purification.
Broad or Poorly Defined Peaks
What to Look For
A main peak that appears wide, rounded, flattened, or lacking a clearly defined apex, rather than sharp and symmetrical.
Why It Warrants Review
Peak broadening can make integration less precise and can obscure smaller components hidden within the peak envelope. When a broad peak conceals co-eluting species, the calculated purity may not fully reflect sample composition.
Possible Contributing Factors
- Suboptimal gradient conditions for that peptide
- Column age or degradation
- Sample overload
- Solubility or aggregation behavior of the peptide
- Inherent chromatographic properties of the sequence
Peak broadening is frequently a method or instrument observation rather than a sample composition observation. It is a reason to examine method details, not an automatic indicator of poor material.
Peak Shape Irregularities
What to Look For
Asymmetry in the main peak — a leading edge that rises gradually (fronting), a trailing edge that descends slowly (tailing), or a visible shoulder on one side.
Why It Warrants Review
A shoulder may indicate a partially resolved component eluting very close to the main peak. Because it is not fully separated, its area may be integrated into the main peak, potentially inflating the apparent purity.
Considerations
Tailing and fronting commonly reflect column condition, mobile phase composition, or secondary interactions between analyte and stationary phase. These are method-related in many cases. A shoulder is more likely to reflect an unresolved component, but confirming this generally requires improved separation conditions or mass spectrometric analysis.
Unexpected Peak Patterns
What to Look For
Peaks appearing at retention times inconsistent with the expected profile for the method, or a distribution of peaks that does not match what the analytical method would predict.
Why It Warrants Review
If a laboratory has historical chromatograms for the same peptide using the same method, a substantially different profile is worth investigating. It may indicate a different lot, a different method, or a change in sample condition.
Practical Approach
Compare the chromatogram against the method parameters stated on the documentation. Confirm the retention time of the main peak is consistent with what the method would produce. If your laboratory has prior chromatograms for the same material, compare directly.
Baseline Abnormalities
What to Look For
Drift, noise, or instability in the baseline — the detector signal between peaks.
Why It Warrants Review
The baseline is the reference against which peak areas are integrated. When it is unstable, integration becomes less reliable, and small peaks may be obscured within the noise.
Common Appearances
- Drift: the baseline rises or falls progressively across the run, often gradient-related.
- Noise: visible irregularity in the signal, which can obscure small peaks.
- Steps or disturbances: abrupt shifts, sometimes associated with injection or solvent changes.
Baseline behavior is largely an instrument and method characteristic. Its relevance is that it affects how confidently the reported peak areas can be interpreted.
Why Peak Area Matters
Purity percentages in peptide documentation are typically calculated from peak area, not peak height.
Purity % = (main peak area ÷ total integrated peak area) × 100
Two consequences follow:
- Peak height alone can mislead. A tall, narrow peak and a shorter, broader peak can represent similar areas. Visual prominence does not directly translate to area proportion.
- Integration parameters affect the result. Decisions about where a peak begins and ends, how the baseline is drawn, and which peaks are included in the total all influence the final figure. This is part of why reviewing the chromatogram alongside the percentage is more informative than reviewing the percentage alone.
Review the Full Chromatogram, Not Just the Number
A stated purity percentage compresses a complex dataset into one figure.
The HPLC chromatogram shows information the number cannot:
- Whether the main peak is well-resolved or broad
- How many secondary peaks exist and where they elute
- Whether the baseline supports confident integration
- Whether any shoulder or unresolved feature is present
- Whether the separation performed as the method intended
Two lots reporting identical purity percentages can present visibly different chromatographic profiles. The percentage alone does not distinguish them.
This is a practical argument for requesting analytical documentation that includes the chromatogram image rather than a summary figure only.
Interpret HPLC Alongside Other Analytical Data
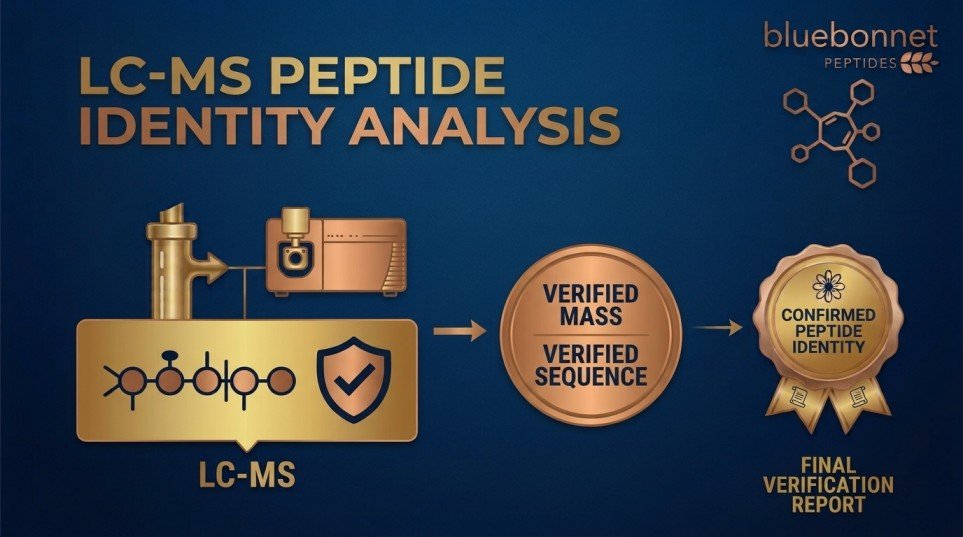
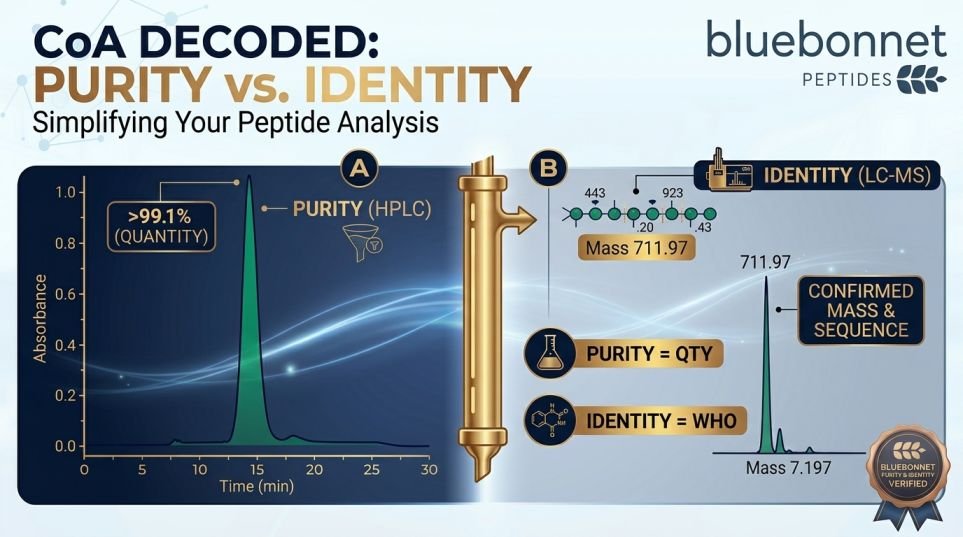
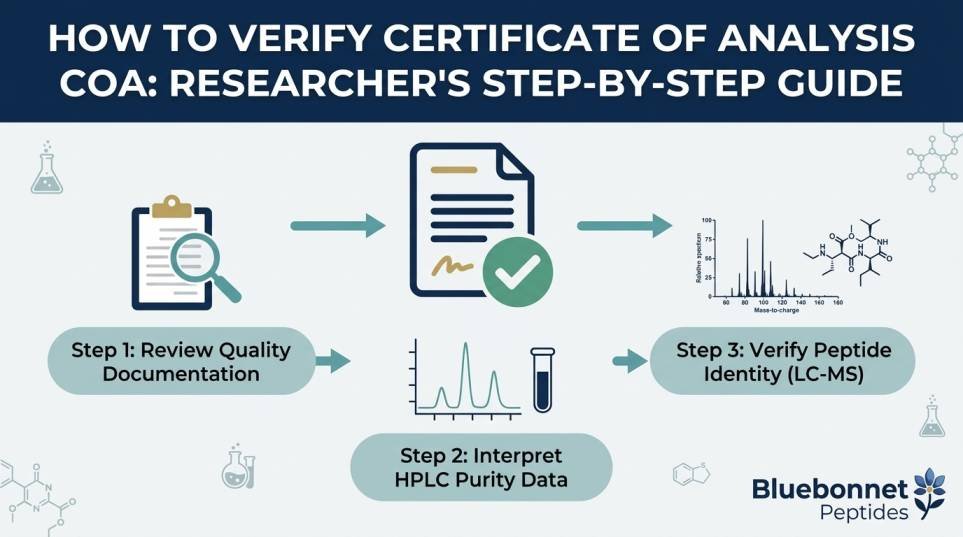
HPLC characterizes chromatographic purity. It does not establish molecular identity.
A chromatogram showing a single sharp peak with a clean baseline indicates one dominant detectable component under those conditions. It does not confirm which compound that component is.
Identity confirmation requires mass spectrometry, which measures molecular weight and compares it against the expected value for the target sequence.
A more complete analytical picture typically includes:
- HPLC purity data with the chromatogram
- Mass spectrometry identity confirmation
- Lot-specific documentation linking both to the material received
- Stated analytical method parameters
Related Reading:
Frequently Asked Questions
Q: Does a single peak on an HPLC chromatogram mean the peptide is pure?
A: It indicates one dominant detectable component under the conditions used. Components that do not absorb at the detection wavelength, fall outside the run time, or co-elute with the main peak may not appear. It also does not confirm compound identity, which requires mass spectrometry.
Q: Are impurity peaks always a problem?
A: Not necessarily. Small secondary peaks are common in synthesized peptides and are accounted for in the purity calculation. What matters is their size relative to the main peak, their number, and whether the total is consistent with the material specification and the intended application.
Q: Can a broad peak be caused by the method rather than the sample?
A: Yes. Peak broadening frequently reflects gradient conditions, column age, sample load, or instrument performance rather than sample composition. This is why chromatographic observations should be evaluated alongside the stated method parameters rather than in isolation.
Q: Why should I look at the chromatogram if the purity percentage is stated?
A: The percentage is derived from the chromatogram and cannot convey peak shape, baseline stability, the number of secondary peaks, or their distribution. Reviewing the chromatogram allows independent evaluation of how that percentage was produced.
Q: What should I do if a chromatogram raises questions?
A: Request the analytical method details and the corresponding mass spectrometry data for the same lot. Confirm the lot number matches your material. Many chromatographic observations resolve once method conditions and identity data are available.
Research Use Only
All information presented here is for educational purposes. Bluebonnet Peptides supplies research peptides for laboratory research use only. These materials are not for human consumption, veterinary use, or therapeutic application, and are not intended to diagnose, treat, cure, or prevent any disease.
 ≥99% Purity
 Third-Party Tested
 COA Available
 U.S.-Based
 Research Use Only